 |
 |
 |
 |
|
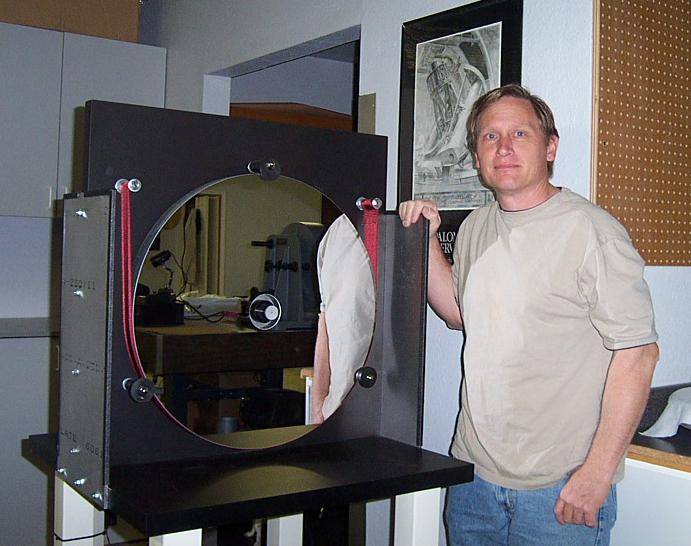
Terry Ostahowski with Optic on test stand |
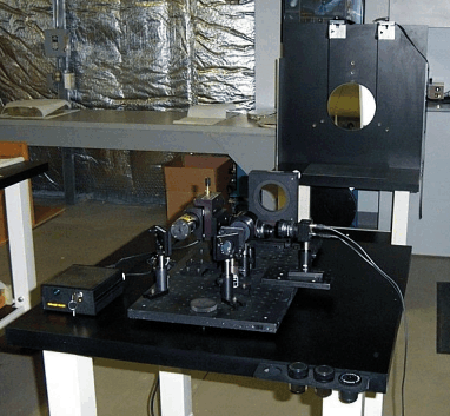
Zygo Interferometer |
Astrosystems is proud to offer Ostahowski optics as well as feature them with our TeleKits and Quantum finished telescopes. All primary mirrors come with interferograms and data analysis. Interferometric documentation is supplied with every optical surface we supply. All of our interferometers incorporate Zygo certified reference elements. Why settle for anything less? Have your peace of mind in knowing that what you paid for is exactly what you are getting. Do not settle for a piece of paper provided by others that is intended to be a certificate of quality. As far as we are concerned, the only “certificate of quality” that you should accept is an actual interferogram photo. Each and every primary mirror is given meticulous attention to detail, from the precise diamond bevels to the pain-staking hand correction to the time-consuming interferometric testing done with double pass auto collimation and Ross-Null test setups. The back surface is ground flat.
An added bonus that others charge extra for:
*All of our primary mirrors have enhanced aluminum coatings included in the price.
Other substrates, sizes and focal ratios are available, please inquire with your specific needs. We will not take an order that we can’t do within a realistic time frame and/or we will not take on any work if we do not have the time necessary to do the job right.
Due to the volatility of materials and demand all Primary Mirrors will need to be quoted.
| Size | f/ratio | Focal Length | thickness | Secondary Size |
| 10" | 6.0 | 60" | 1.6" | 1.8" |
| 12.5" | 5.0 | 62.5" | 1.6" | 2.6" |
| 14.5" | 4.6 | 67.5" | 1.6" | 2.6" |
| 15" | 4.5 | 67.5" | 2.0" | 2.6" |
| 16" | 5.0 | 75" | 1.6" | 3.1" |
| 18" | 4.44 | 80" | 2.0" | 3.1" |
| 20" | 5.0 | 100" | 2.0" | 3.1" |
| 22" | 4.5 | 100" | 2.0" | 3.5" |
| 24" | 4.5 | 108" | 2.0" | 4.0" |
The following information is provided to improve the understanding of optical testing and interferometry. This is the cornerstone of optical certification and testing used to fabricate every Ostahowski optic.
INTERFEROMETRY - THE MYTH BUSTER
If you have searched the internet lately looking for a telescope or perhaps a set of optics you no doubt have come across a lot of information relating to “how good” ones telescope or optics are. Unfortunately a lot of this information is confusing and in some cases down-right misleading.
Regardless of how the telescope or optic is tested there is only one way to accurately determine optical quality as expressed in waves or fractions there of, Interferometry. Yes, Interferometry.
....please read on.
Interferometry examines the converging wave front in hundreds and sometimes thousands of points and compares them to a wave front of a known quality (high quality) reference, a comparison is made between the two, preferably by software and computer. However, in this case a picture can be worth a thousand words or should we say a thousand dollars. An interferogram photo can be readily dissected by someone who has even limited Interferometry knowledge and even without a computer generated plot, one can make an accurate assessment to the general quality of the optic or telescope. The interferogram is the only way to truly measure the wave front. The entire optic is analyzed at one time and interferometry “takes no prisoners”. The good of this is that with interferometry one can further manipulate the final correction to a level that one could not (with certainty) achieve otherwise.
Now I know you probably have read that certain “optical companies” are making some incredible claims about their work and are providing a piece of paper, a “certificate” if you will, to prove it. If you are paying top dollar you do not want to purchase a paper “certificate”, you want and should demand an interferogram photo.
In virtually all cases, an optic tested via interferometry will not be “as good” as one tested and plotted on a line via any of the knifedge programs. The reason for this is when an optic is tested by knifedge only a few select zones are measured and compared, these zones are rather large compared to a “point” and we feel that the numbers reported by mirror makers using this procedure actually should be RMS numbers (at best) and not P-V numbers.
This is not to say that the knifedge tester is incapable of making excellent mirrors, we know it can be used to do such that. What we really are trying to convey here is it simply cannot be used to compute wave front and RMS claims to the same accuracy as interferometry and certainly not greater. We know that any optic that has computed P-V and RMS values by Foucault testing will rarely, if ever, approach the same values when tested by interferometry. We see this over and over again and this is not just my opinion. This places the company who has invested countless dollars into interferometry and software at a very unfair advantage in the competitive consumer market. Thankfully the Government, Aerospace companies and well informed consumers know the truth behind optical testing and what numbers are reality and which are fiction.
We do use the Foucault tester in our shop, it has it’s place and it is a tool - one of many - that every shop should have. It’s use to see small zones goes without mention. It simply can’t be used alone to generate P-V and RMS numbers. Any optic that comes with “certification” that is not derived from interferometry should be suspect at best, especially if the P-V is better than 1/10 wave. Please consider the fact that ZYGO (as well as a few other reputable companies) sells certifiable and traceable reference spheres & flats (1/10 - 1/20) wave at a cost of $5,000 to $15,000 each! Please don’t tell us that someone reading a parabolic surface with a knifedge - at radius - in their basement - can do better than that. It just doesn’t happen.
TEST DATA
What does it all mean? A test report should
include the following information.
1) An actual interferogram photo
2) Synthetic interferogram photo (optional but
never in place of an actual interferogram photo).
3) RMS data
4) P - V data
5) Strehl data
6) and sometimes astigmatism
Most reports will also include other information
like
data points, Wavelength tested, scale, serial number of
optic/telescope tested, etc.
I would like to describe in a little more detail
what you
should look for in your test report, whether you buy from
us or anybody else.
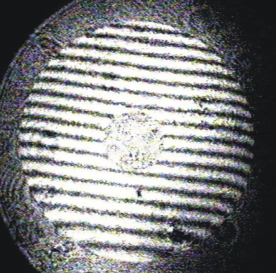
1) INTERFEROGRAM PHOTO (see examples below).
This is what I’d consider as the “Holy
Grail” of optics. Even
without a computer generated data analysis sheet one can
come to reason ,within a certain degree of accuracy, a quality
assessment of the optic or optical system under test. If you are
provided with a synthetic interferogram it should match very
closely to the actual interferogram. For your own protection
you should not accept a synthetic interferogram as your only
“proof” on your optic or optical system
 |
It can be difficult to capture interferograms.
The interferometer
is usually a very expensive system so cost is one hurtle and then
one has to deal with a very large OPD (optical path difference)
which has it’s own difficulties, namely vibration and unwanted
air movement. Telescope mirrors are usually tested at focus
or at radius, depending on the interferometer, and the separation
between the two can be many feet.
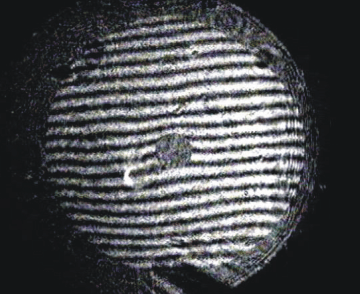
The examples above are from very accurate optics that test at or in excess of 1/10 wave.
2) SYNTHETIC INTERFEROGRAM
I do not place to much value in the synthetic
interferogram. It does have it’s place in a report but it can be distorted and
manipulated which is why you always want to see the
actual interferogram.
3) RMS DATA
Rather than trying to impress you as to how the
software
creates these values I’d like to tell you what numbers you
should look for. In theory this needs to be 0.075 or lower
to be “diffraction limited”. However this is just one of the
values that need to be taken into consideration. Well corrected optics/telescopes will usually have an RMS value
in the 0.080 to 0.095 range. Please remember that large
and/or “fast” optics become increasingly difficult to figure
to the same “tight” high tolerances as smaller optics and
you will see that the RMS values are affected.
4) P-V DATA
This seems to be the one value that everyone
looks at first
and I’m as guilty as you are, however it is just one of the
values to be taken into consideration in evaluating optics
or telescopes. The “old” school of thought is that an optic
or system needs to be 1/4 wave P - V or better to be
“diffraction limited”, but that is not necessarily the case.
You like to see 0.250 P - V or less and you
usually do on
small to moderately sized optics (not easy but very attainable),
but you may not get that value on large “fast” optics and the
reason is that the software data is using fringe centers or
points numbering in the hundreds or even thousands and the
P- V is the lowest point and the highest point out of these
hundreds or thousands of points. So you can see with the
difficulties of figuring a fast optic, vibration and unwanted air
movement this value could get easily distorted which is why
it should be considered as the third most important value to
look at, after Strehl and RMS.
5) STREHL DATA
This value is of great importance in optical
evaluation. It is
also one of the values most grossly exaggerated by
optical manufactures who incorporate testing other than interferometry. Theoretically this value should be 0.80 or
higher, you will typically see 0.90 - 0.95. This value
becomes more difficult to attain as you work larger and
“faster” optics. Please be skeptical of Strehl numbers that,
for example, are posted as 0.998. I can assure you that
whomever posted a number like that did not use interferometry
to attain the data.
6) and ASTIGMATISM, sometimes........
Astigmatism is difficult to see or detect unless
it is gross
(greater than 1/4 wave). The interferometer can detect it
and it certainly is detected with the computer generated
software. The difficulty with this is that sometimes even
the weight of the optic being tested and resting in a vertical
position can create astigmatism. So what is real and what isn’t?
Fortunately one can rotate the optic and determine whether the
optic is astigmatic or not. We also subject every optic to a high
power/artificial star test, usually 600X to 1000X, this allows us
to mimic a star but under controlled shop conditions without the
turbulent atmosphere interfering.
The optic must not show any trace of astigmatism
with this test,
if it does it is reworked until it is removed. You will usually see
astigmatism subtracted from test data if it is small enough not to
be seen but is picked up by the software analysis program in
trace amounts. Once again, the actual interferogram would
certainly show astigmatism if it were large enough to affect the
optical performance.
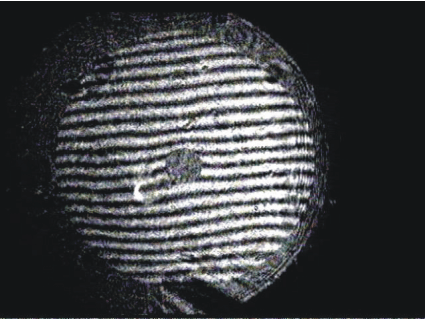
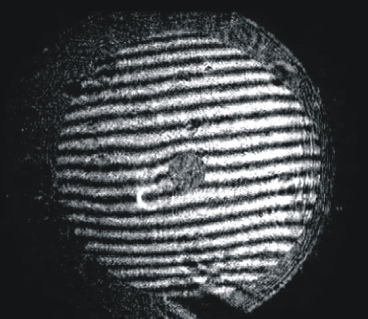
The data provided below is actual data supplied
to a customer. The optic is a 15" f/5 mirror and four sets of interferograms were
averaged together.
 |
 |
 |
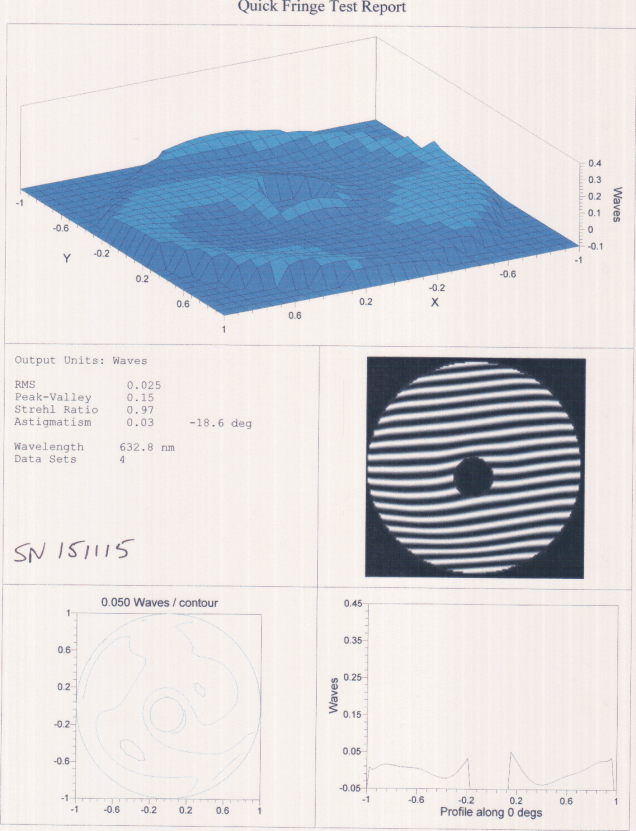 |
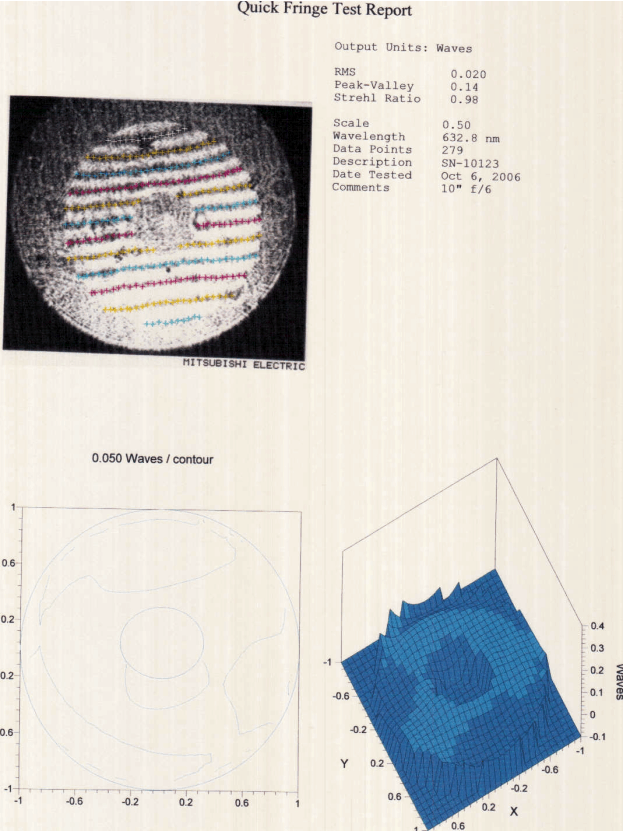
In the example above please note the similarity
to the interferograms
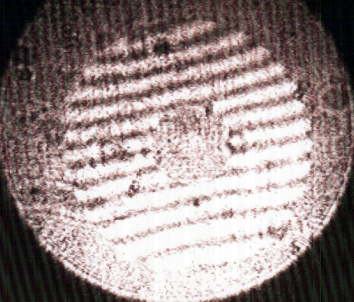
and the synthetic interferogram. In the example below the interferogram
is included along with the fringe centers, this is how we normally supply
the data sheet.
 |
 |